Contour Lines Explained Simply: A Beginner’s Guide to Reading Topographic Maps
If you’ve ever looked at a topographic map and felt confused by the curved lines and numbers — you’re not alone.
Contour maps may look complicated at first, but once you understand the basics, they become one of the most powerful tools in civil engineering, surveying, land development, and site design.
In this guide, we’ll explain contour lines, contour intervals, elevation, slopes, and key contour terms in the simplest way possible — perfect for beginners.
What Are Contour Lines?
A contour line is a line on a map that connects points of equal elevation.
In simple words:
👉 Every point on the same contour line is at the same height above sea level.
For example:
If a contour line is labeled 500, it means every point on that line is 500 feet above sea level.
Contour lines help us understand the shape of the land without seeing it in real life.
What Is Contour Interval?
The contour interval is the vertical distance between two consecutive contour lines.
Why is contour interval important?
✅ It tells you how steep the land is
✅ It helps calculate slopes
✅ It improves grading design
✅ It controls drainage planning
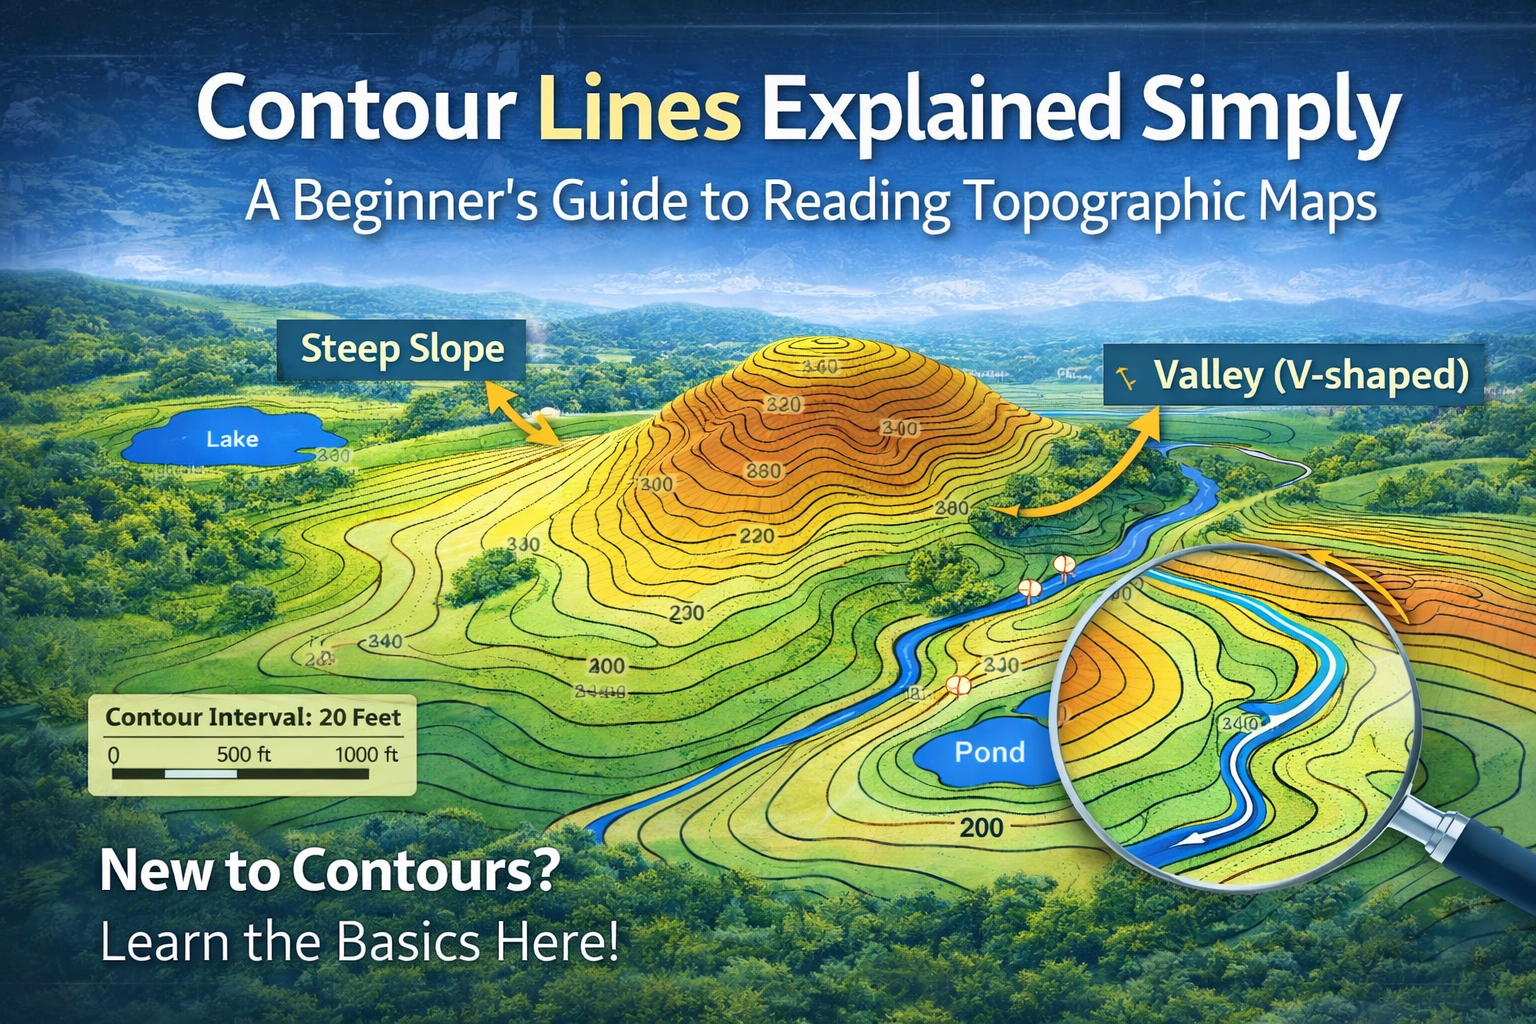
How to Identify a Hill on a Contour Map
A hill is shown as closed circular contour lines.
The elevation numbers increase as you move toward the center.
That means elevation is increasing inward — so this is a hill.
👉 Rule: If numbers increase inside the circle → It’s a hill.
How to Identify a Valley or River
When contour lines form a “V” shape, it usually indicates a valley or stream.
Important Rule:
👉 The “V” shape points uphill.
Water always flows from higher elevation to lower elevation.
How to Read Slopes Using Contours
The spacing between contour lines tells you how steep the land is.
Closely Spaced Lines = Steep Slope
When contour lines are very close together, the land elevation changes quickly.
👉 Steep area.
Widely Spaced Lines = Gentle Slope
When contour lines are far apart, the elevation changes slowly.
👉 Flat or gentle slope.
This is extremely important in:
- Road design
- Grading
- Drainage
- Construction planning
What Is Elevation?
Elevation is the height of a point above a reference level (usually mean sea level).
In contour maps:
The numbers written on the lines represent elevation values.
For example:
300 means 300 feet above sea level.
Key Contour Terms Every Beginner Should Know
Here are some important contour-related terms explained simply:
1. Index Contour
A darker or thicker contour line that is labeled with elevation.
It helps you read the map easily.
2. Intermediate Contour
Lighter contour lines between index contours.
3. Depression Contour
Shows a low area or basin.
Usually drawn with small tick marks pointing inward.
4. Ridge
A high narrow area of land.
Contour lines form elongated shapes.
5. Valley
Low area between hills.
Contour lines form “V” shapes pointing uphill.
6. Benchmark (BM)
A fixed reference point with known elevation.
7. Spot Elevation
A single point showing exact elevation.
Why Contour Maps Are Important in Civil Engineering
Contour maps are used in:
✅ Road and highway design
✅ Building pad design
✅ Drainage planning
✅ Earthwork calculations
✅ Site development
✅ Flood analysis
Without understanding contours, grading and infrastructure design becomes extremely difficult.
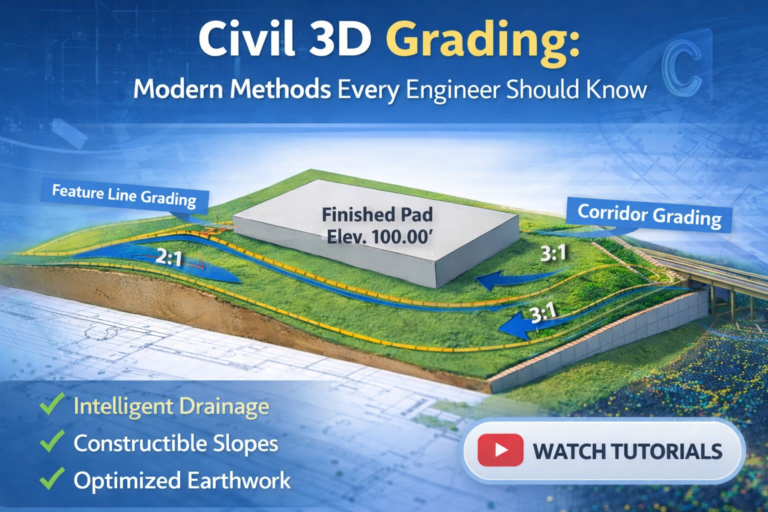
Contours in Civil 3D
In Civil 3D, contour lines are generated automatically from a surface model.
Surfaces are created using:
- Survey data
- COGO points
- Drone mapping
- Breaklines
Once a surface is built, Civil 3D displays contour lines based on selected contour intervals.
👉 Smaller interval = More detail
👉 Larger interval = Simpler map
Common Beginner Mistakes When Reading Contours
❌ Thinking contour lines cross each other (they never cross)
❌ Ignoring contour interval
❌ Misreading valley direction
❌ Assuming equal spacing means equal slope everywhere
Understanding contour basics prevents major grading and drainage errors.
Simple Trick to Master Contours
Ask yourself three questions when looking at a contour map:
- Are numbers increasing or decreasing?
- Are lines close together or far apart?
- Where will water naturally flow?
If you can answer these, you understand the land.
Final Thoughts
Contour maps may look complex, but they are simply a 2D way of representing 3D land.
Once you understand contour lines, contour intervals, slope spacing, and elevation direction, reading a topographic map becomes easy and even enjoyable.
For civil engineers, surveyors, and students — mastering contours is the foundation of smart site design.
👉 Learn contours today — design confidently tomorrow.