Using the Section Editor
To understand how the Section Editor works, let’s review the corridor creation process. An alignment and a profile are combined to generate a 3D chain, where an assembly is repeatedly placed along this chain to form the complete model. The assembly represents a static version of the road’s cross-section, but it doesn’t show how subassemblies interact with assigned targets.
The Section Editor allows you to view each assembly placement in a cross-section view, including interactions with targets. You can also make adjustments to corridor sections, refining your design with precision.
Clicking Section Editor on the ribbon opens the Section Editor tab, providing tools to navigate and configure the editor. Using multiple viewports—such as plan, profile, and section views—can help visualize your design from different perspectives. A key feature of the Section Editor is the marker that appears on the alignment and profile, indicating the section you are currently viewing.
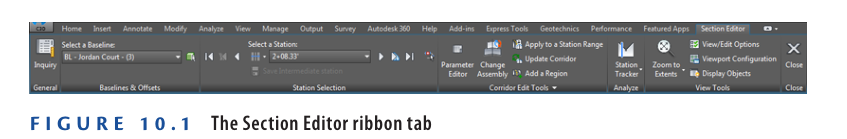
As the name suggests, the Section Editor allows you to modify your corridor design. This is achieved using the Parameter Editor command found on the Section Editor ribbon tab. This command displays all subassemblies and their related settings at a specific corridor location. You can override these settings for individual corridor sections or apply changes across multiple stations. Any modifications made here are stored as overrides within the corridor.
Exercise 10.1: View and Edit with the Section Editor
In this exercise, you’ll use the Section Editor to review the corridor design for Jordan Court in section view and remove unwanted ditches from the design.
- Open the drawing Using Section Editor.dwg, which you can download from Video tutorial description below.
- In the left viewport, select the corridor by clicking one of the blue corridor lines. Then, switch to the upper-right viewport and click Section Editor on the ribbon.
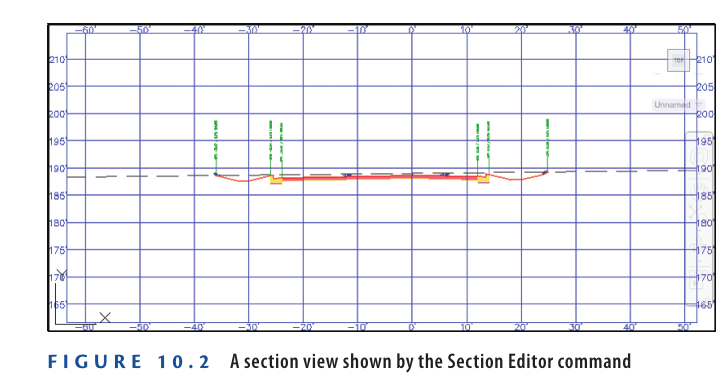
The upper-right viewport will update to display a cross-section of the corridor at the location you selected before activating the Section Editor command(see figure 10.2)
3: In the left viewport, zoom out to see both the plan view of the site and the Jordan Court profile view. On the ribbon, click the Go To Next Station icon to move to the next corridor section. Continue advancing through multiple corridor sections.
4: On the ribbon, open the Select A Station dropdown list and choose 1+75.00′ (0+050.00 m). Zoom into the section view and observe the ditches on either side of the road.
The ditches were automatically added due to the road being in a cut condition. However, since the cut is minimal, the ditches can be removed. The following steps will apply this modification.
4: Click Parameter Editor on the ribbon to open the Corridor Parameters window.
5: In the Corridor Parameters window, scroll to Left Daylight, then set Backslope Width and Foreslope Width to 0.000. Repeat this step for the Right Daylight subassembly.
6: Click Close on the ribbon to exit the Section Editor and return the drawing to its normal state.
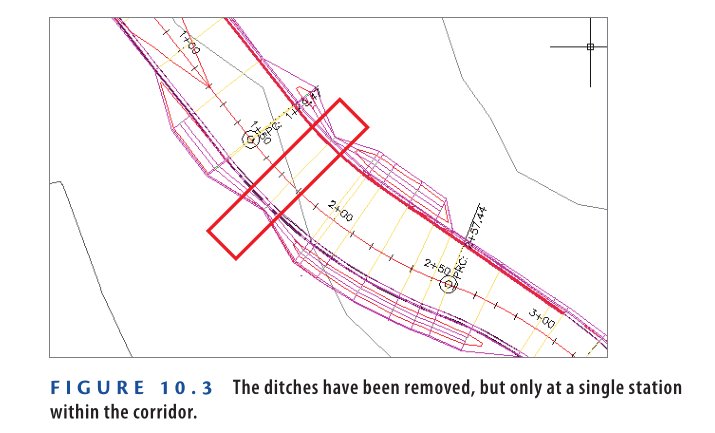
7: If you zoom into the plan view, you’ll see that the ditch has been removed, but only at a single corridor location(Figure 10.3).
- Click one of the blue corridor lines, then click in the upper-right viewport and select Section Editor from the ribbon. Choose station 1+75.00′ (0+050.00 m) again.
- On the ribbon, click Parameter Editor.
- Click Apply To A Station Range on the ribbon.
- In the Apply To A Station Range dialog box, click the Pick button next to Start Station. Select a point in the left viewport, just northwest of the ditches.
- Repeat the previous step for the End Station value, selecting a point southeast of the ditches.
- Click OK to close the Apply To A Station Range dialog box, then click Close to exit the Section Editor.
- Select the corridor and click Rebuild Corridor on the ribbon.
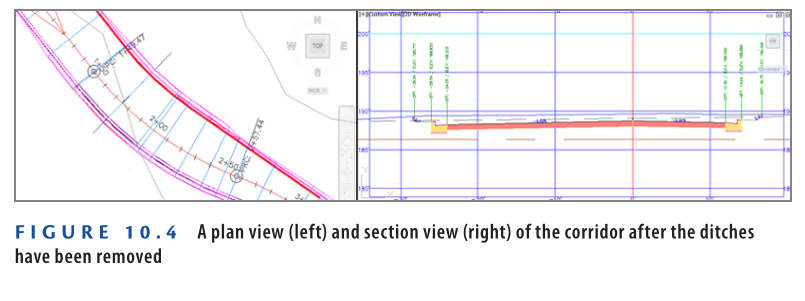
The ditches are now removed from the corridor(Figure 10.4).
- Save and close the drawing.
You can view the results of successfully completing this exercise by opening
Using Section Editor – Complete.dwg,
https://www.mediafire.com/file/l212p7v8agqjsr1/Using+Section+Editor+-+Complete.dwg/file
Watch Complete Video Tutorial here for this Exercise:
What’s in a Name?
In Exercise 9.3, you renamed individual subassemblies in the road design. Now, in Exercise 10.1, you can see how names like Left Daylight and Right Daylight help streamline the process. Spending a few extra seconds on organization can make a big difference later in the design. This is especially useful in team environments, where good documentation saves time and effort for everyone.
Creating Sample Lines
In a profile, the alignment defines the path along which the profile is cut. For cross sections, this role is taken by sample lines. These lines are linked to an alignment and are usually created in bulk, requiring them to be placed in a sample line group. An alignment can contain multiple sample line groups if needed. The hierarchy for sample lines in Civil 3D is:
Alignment ➝ Sample Line Groups ➝ Sample Lines
When you launch the Sample Lines command from the ribbon, you are prompted to:
- Select the parent alignment.
- Name and stylize the sample lines.
- Choose data sources for cross-section creation. Civil 3D allows sampling from:
- Surfaces
- Corridors
- Corridor surfaces
- Pipe networks
Once sample lines are created, the Sample Line Tools toolbar appears, offering various tools for placing and modifying sample(see Figure 10.5) lines within a sample line group.
On the Sample Line Tools toolbar, a dropdown menu provides multiple methods for placing sample lines along the alignment.
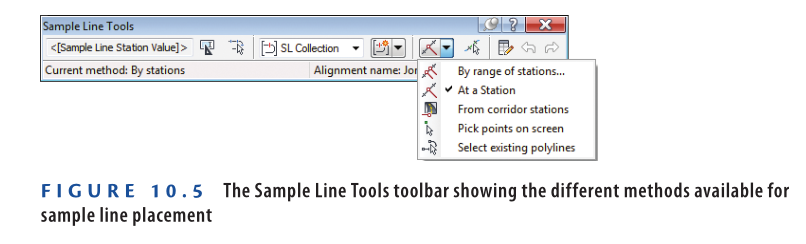
- By Range of Stations – Creates multiple evenly spaced sample lines along the alignment with predefined swath widths. These lines are perpendicular to the alignment and are useful for generating a large number of sample lines.
- At A Station – Places sample lines at specific station values by defining left and right swath widths. This method is ideal for manually placing a few sample lines at irregular locations.
- From Corridor Stations – Generates sample lines at every assembly insertion on the corridor, making it useful for design cross sections. Requires a corridor as a data source.
- Pick Points on Screen – Allows you to manually draw sample lines by clicking points on the screen. Useful for irregularly shaped sample lines that aren’t perpendicular to the alignment.
- Select Existing Polylines – Similar to the Pick Points method but uses pre-drawn polylines to define the sample lines.
Exercise 10.2: Create Sample Lines
- Open the drawing Creating Sample Lines.dwg which you can download from Video tutorial description below.
- On the Home tab of the ribbon, click Sample Lines.
- When prompted to select an alignment, press Enter and choose Jordan Court in the Select Alignment dialog box. Click OK.
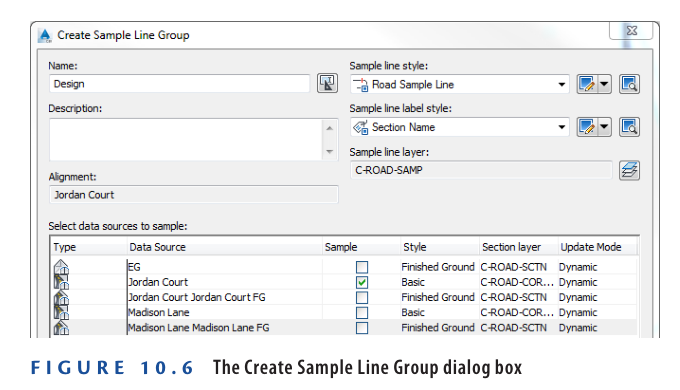
- In the Create Sample Line Group dialog box:
- For Name, enter Design.
- For Sample Line Style, ensure Road Sample Line is selected.
- For Sample Line Label Style, confirm Section Name is selected.
- Under Select Data Sources To Sample, uncheck all except the second checkbox.
- Verify that all settings match Figure 10.6, then click OK.
4: On the Sample Line Tools toolbar, expand the dropdown menu for creation methods and select From Corridor Stations.
5: In the Create Sample Lines – From Corridor Stations dialog box, click OK to accept the default settings and generate the sample lines.
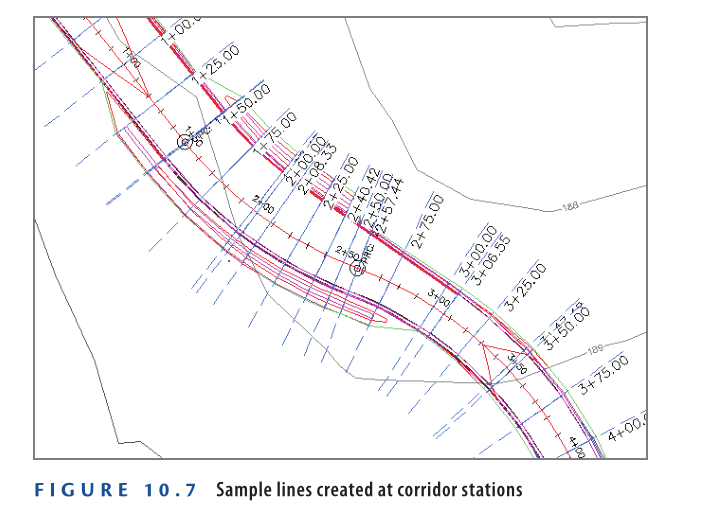
6: Press Esc to exit the command. Then, zoom into the left viewport to inspect the newly created sample lines (see Figure 10.7).
- Save and close the drawing.
You can view the results of successfully completing this exercise by opening
Creating Sample Lines – Complete.dwg.
https://www.mediafire.com/file/f3yqxfcil4ewmm0/Creating+Sample+Lines+-+Complete.dwg/file
Watch Complete Video here for this Exercise:
Creating Section Views
Now that you have sample lines in the drawing that have captured section data from the selected sources, you need a way to display that data. Just as a profile needs a profile view to be visible, a cross-section requires a section view. Section views are similar to profile views, typically displaying a grid and grid labels as a backdrop for the data. The section view is dynamically linked to the sample line and associated data sources, meaning any modifications to the sample or source data will automatically update the section view.
Creating Individual Section Views
Since section views are often created in large numbers, handling them efficiently is important. However, this section focuses on creating individual section views.
Exercise 10.3: Create Individual Section Views
In this exercise, you will create an individual section view for close inspection of a design at a key location.
- Open the drawing named Creating Single Section Views.dwg which you can download from video tutorial description below.
- In the left viewport, zoom in to the sample line labeled 13+25.00 (0+405.00). Click the sample line and then click Create Section View ➢ Create Section View on the ribbon.
- In the Create Section View – General dialog box, verify the following settings:
- Select Alignment: Jordan Court
- Sample Line Group Name: Design
- Sample Line: 13+25.00 (0+405.00)
- Station: 13+25.00′ (0+405.00 m)
- Section View Style: Design
- Click Next to proceed to the Create Section View – Offset Range dialog box.
- Click Next to proceed to the Create Section View – Elevation Range dialog box.
- Click Next to proceed to the Section Display Options dialog box. Verify that the style selected for the Jordan Court corridor section is Design.
- Click Next to proceed to the Data Bands dialog box. Ensure that Design Offsets is selected under Select Band Set, then click Create Section View.
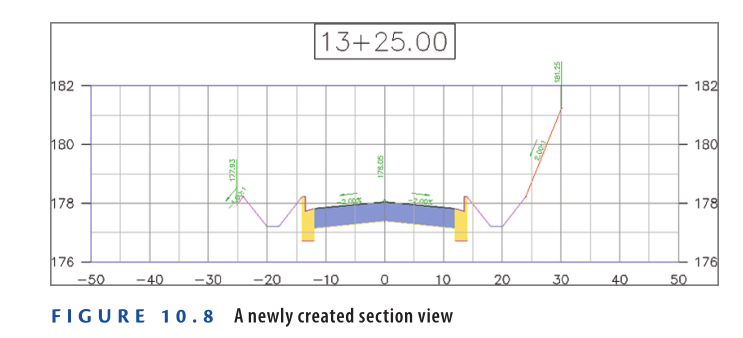
- When prompted to specify the section view origin, pick a point near the center of the upper-right viewport.
A new section view will be created in the drawing(Figure 10.8).
- Save and close the drawing.
You can view the results of successfully completing this exercise by opening
Creating Single Section Views – Complete.dwg.
https://www.mediafire.com/file/ngf1jlemaq5yjx5/Creating+Single+Section+Views+-+Complete.dwg/file
Watch Complete Video tutorial here for this Exercise:
Style by Design
Many of the styles selected during the section view creation process include the word Design in their names. These styles are specifically configured to aid designers during the design phase but may not be suitable for final construction drawings. For example, elevation and slope labels in the section view may be too small to read when plotted, but they are useful for quick reference while zoomed in. Using different styles for design and documentation can help streamline both processes effectively.
Creating Multiple Section Views
For certain projects, cross-section views must be documented at regular intervals along the design, which is especially common in road design. Although modern techniques have reduced reliance on cross-section views, they are still widely used in construction documentation. Due to space constraints, multiple section views are typically placed across several sheets, arranged efficiently within a printable area using a group plot style.
Exercise 10.4: Create Multiple Section Views
In this exercise, you will use a sample line group configured for section sheets to create multiple sheets with section views.
- Open the drawing named Creating Multiple Section Views.dwg which you can download from Video tutorial description below.
- On the Home tab of the ribbon, click Section Views ➢ Create Multiple Views.
- This opens the Create Multiple Section Views Wizard, starting with the General dialog box.
- In the Create Multiple Section Views – General dialog box, select Section Sheets for Sample Line Group Name, then click Next.
- In the Create Multiple Section Views – Section Placement dialog box, ensure that Production is selected under Placement Options.
- Click the ellipsis (…) next to the path to open the Select Layout As Sheet Template dialog box.
- Click the ellipsis (…) again in the Select Layout As Sheet Template dialog box to browse for a template file.
- Navigate to the Chapter 10 class data folder, select Sections.dwt, and click Open.
- Select ARCH D Section 20 Scale (ISO A0 Section 1 To 200) and click OK. Ensure that Group Plot Style is set to Plot By Page.
- Click Next through the remaining dialog boxes in the Create Multiple Section Views Wizard and review the settings. Click Create Section Views.
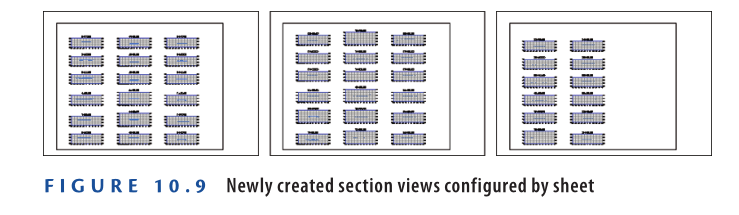
- Click a point in the upper-right viewport in the open area to the north of the project. This will generate three new section sheets.
Why More Sample Lines?
Previously, sample lines were created using the From Corridor Stations method, which places sample lines at each assembly insertion of the corridor. This configuration is useful for design purposes, allowing designers to inspect sections at key points. However, for construction documentation, cross-sections are needed at regular intervals.
Since multiple sample line groups can be created for a single alignment, one group can be used for design review and another for construction documentation. In Prospector, you will notice that the Design sample line group remains, but its styles have been adjusted to hide the sample lines and labels(Figure 10.9).
- Save and close the drawing.
You can view the results of successfully completing this exercise by opening
Creating Multiple Section Views – Complete.dwg.
https://www.mediafire.com/file/ndqjkiy64kpk7ps/Creating+Multiple+Section+Views+-+Complete.dwg/file
Watch Complete Video tutorial here for this Exercise:
Sampling More Sources
Corridors are not the only data sources that can be sampled and displayed in cross-section views. Sample lines can also capture data from surfaces and pipe networks. This allows for a more comprehensive analysis of design elements. Additionally, more data sources can be added to existing sample lines and section views, avoiding the need to recreate them from scratch when new data becomes available.
Exercise 10.5: Sample More Sources
In this exercise, you will add new data sources to your drawing, sample them, and display them in section views.
- Open the drawing named Sampling More Sources.dwg which you can download from Video tutorial description below.
- Click one of the section views in the upper-right viewport.
- On the ribbon, click Sample More Sources.
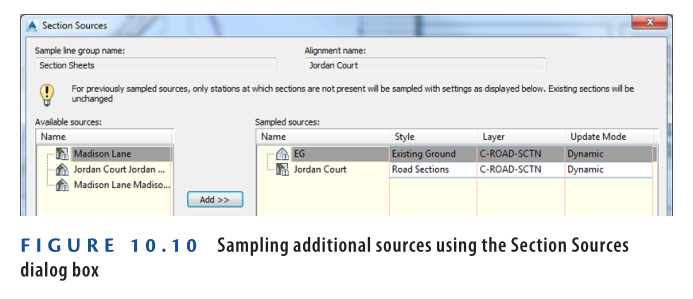
- In the Section Sources dialog box:
- Under Available Sources, click EG (Existing Ground).
- Click Add to move it to Sampled Sources.
- Under Sampled Sources, confirm that the style for EG is set to Existing Ground.Verify that the Section Sources dialog box matches Figure 10.10, then click OK.
- After a brief pause, a red dashed line will appear in each section view, representing the existing ground surface.A default label set will also be applied to the existing ground line, but it may not be appropriate for this application. The next steps will involve removing these labels.
7. On the Sections tab, click <Edit> in the Label Set column next to EG.
8. Select _No Labels, then click OK twice to apply changes and return to the drawing.
9. In the top-right viewport, zoom in to the first section view at 0+50 (0+010) in the lower-left corner of the first sheet. Pan upward, reviewing each section. When reaching the top of a column, move to the bottom of the next column and continue panning upward.
10. On the Insert tab of the ribbon, click LandXML. Browse to the Chapter 10 class data folder, select Preliminary Waterline.xml, and click Open.
11. Click OK to dismiss the Import LandXML dialog box.
- A new pipe network representing the preliminary waterline design along Jordan Court is now created.
- If you zoom into the plan view of Jordan Court, you’ll see a double blue line on the right side of the road.
- Click one of the section views, then click Sample More Sources on the ribbon.
- In the Section Sources dialog box, select Preliminary Waterline, click Add, then click OK.
- Press Esc to clear the selection. Zoom in and examine the section views to verify that the waterline is displayed.
- Use the LandXML command again to import Subsurface Rock.xml.
- Use Sample More Sources to add the new surface named Rock to the section views.
- Set its style to Rock.
- To remove unnecessary labels:
- Click a section view, then click View Group Properties on the ribbon.
- Click <Edit> in the Label Set column next to Rock.
- Select _No Labels, then click OK twice to return to the drawing.
- Examine the section views again:
- The waterline crosses the rock layer, indicating significant excavation may be needed.
- At station 9+00 (0+270), the rock layer is very close to the surface. Raising the road elevation in this area might help reduce excavation costs.
- Save and close the drawing.
You can view the results of successfully completing this exercise by opening Sampling More Sources – Complete.dwg.
https://www.mediafire.com/file/0efkqd7nc2ulhbl/Sampling+More+Sources+-+Complete.dwg/file
Watch Complete Video Tutorial here for this Exercise:
Understanding Section Views in Road Design
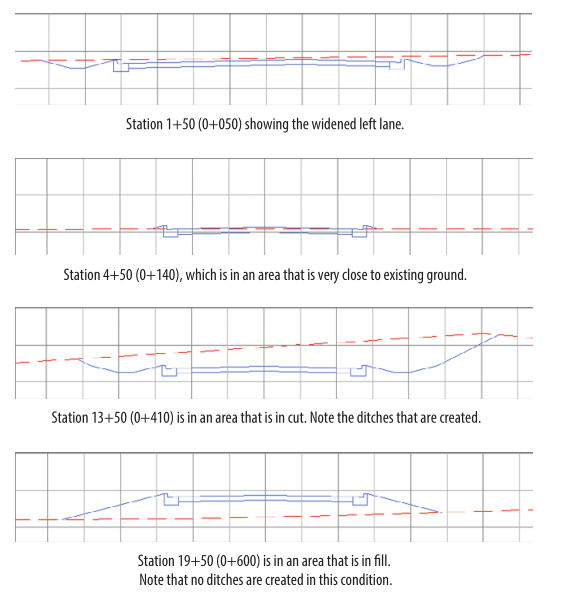
As you move from one section view to another, the construction story of the road unfolds. In the initial sections, the road cross-section is notably wider on the left to accommodate the turning lane integrated into the corridor. Further along, you observe sections that closely match the existing ground elevation, sections elevated above the ground (fill condition), and sections cut below the ground (cut condition).
The elevation relationship between the road and the existing ground significantly impacts drainage for future homes along the road. In cut conditions, ditches have been introduced to manage water flow effectively. These simple section views provide valuable insights and raise essential questions about the design, construction efforts, and costs involved. The following images highlight key aspects of this design.
Now You Know
After completing this chapter, you can use the Section Editor to view and edit corridors in section views. You can create sample lines and select the data to be captured and displayed in section views. You have learned to generate section views individually and in groups arranged on sheets. Additionally, you can add more data sources to section views to provide supplementary road design information. Now, you are prepared to work with sections and section views in a production environment.