Survey Data
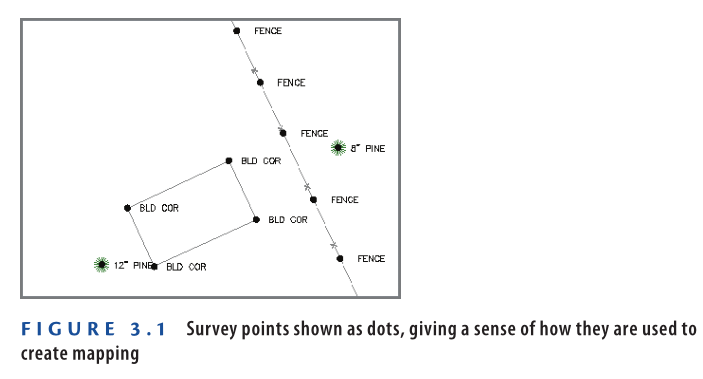
Think back to the last time you played connect-the-dots to draw a picture. Ever wonder who made the dots and how they were made? I’m no expert, but I’m guessing someone took the original picture, laid a piece of tracing paper over it, and made dots along the edges of key features in the picture. Someone skilled at this would make just enough dots to define the features but not so many as to make them confusing or wasteful. The dots are a way of capturing an image and transferring it to another location.
In land development, the land is the picture, and the surveyor is the one who makes the dots—referred to as points. Obviously, tracing paper can’t be used, so the surveyor lays an imaginary grid over the land (a coordinate system) and creates the points as information by recording their coordinates on this grid paper. The tools the surveyor uses are extremely accurate and capable of capturing the location of each point within a tolerance of about 1⁄8 of an inch (3 mm). Something different about the surveyor’s “dots” is that their location is recorded in all three dimensions. This enables a technician to play connect-the-dots in 3-D to create a 3-D model in addition to a 2-D map of the features of the land. Another difference is that a surveyor’s dots have description codes next to them instead of just numbers. A description code identifies the type of feature that a dot, or point, is intended to represent.
If you’re thinking that it takes a lot of points to capture several acres of land, you’re absolutely right. How can you keep track of all those points? How can they be easily turned into a 3-D model of the land? Is there some way of automating the connect-the-dots process? Civil 3D 2025 has the answers to these questions, and in this chapter, you’ll learn how you can use Civil 3D 2025 to transform raw field points into maps and 3-D models of the land.
Reality Capture
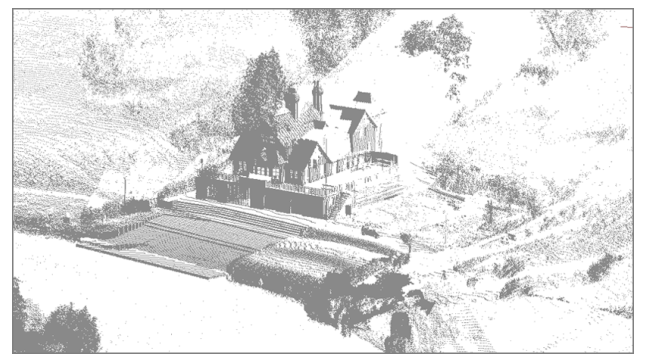
The technology of reality capture has become more common in recent years. Reality capture refers to the use of high-density laser scanners to collect millions or even billions of data points. The resulting data is often referred to as a point cloud because, due to its density, the data often looks like a cloud or fog. With this approach, there is no need to play connect-the-dots because the data points are so close together that they define the shape of the land.
Although it’s not covered in this book, you should know that Civil 3D 2025 has the ability to import and use point cloud data to create a model of an existing piece of land. The image here shows an example of point cloud data that has been imported into Civil 3D 2025.
Creating a Survey Database
In Chapter 2, “Leveraging a Dynamic Environment,” you learned about the importance of relationships in Civil 3D and saw firsthand how Civil 3D makes use of interactions between different object types. When you’re dealing with survey data, these relationships are managed in a survey database. The raw data is linked with the screen representation of the points in the survey database, which is linked with the linework generated by connecting those points, and so on. The survey database is unique in Civil 3D 2025 in that it’s stored outside the drawing file.
Exercise 3.1: Create a Survey Database
In this exercise, you’ll create a survey database.
- Open Civil 3D 2025 and click New on the application menu. When prompted for a template, open
Essentials.dwtwhich you can download from Youtube video description - Click the Survey tab in the Toolspace.
- Right-click Survey Databases, and select Set Working Folder.
- Browse to and select the Chapter 03 class data folder, and click OK.
The Survey Working Folder
The working folder is the location where survey databases are stored. In this exercise, you’ll create a survey database named Essentials. This will create a folder in Chapter 03 named Essentials.
- Right-click on Survey Databases, and select New Local Survey Database.
- Type
Essentialsas the new database name, and click OK.
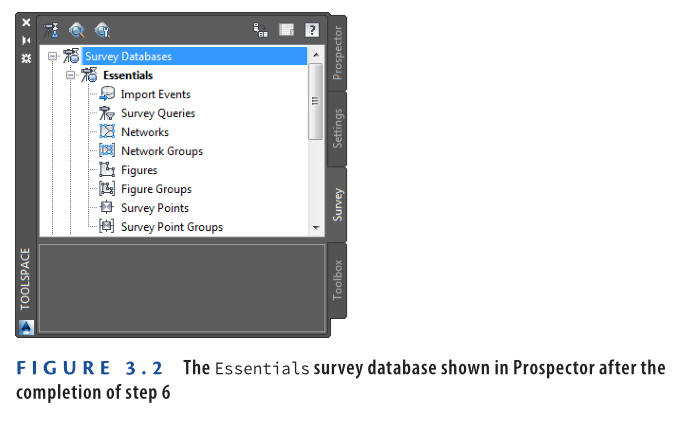
The Essentials database now appears on the Survey tab. Note the components of the survey database, such as Import Events, Networks, Figures, and Survey Points(figure 3.2). The survey database establishes and manages relationships between these different components.
- Close the drawing without saving.
There is no “Complete” drawing for this exercise because you did not modify a drawing file. You did create a new survey database, but it’s currently empty. In the next exercise, you’ll use the Essentials 1 survey database, which has already been created for you.
Watch Complete video here for this exercise:
Importing Survey Data
After creating a survey database to receive the data, the next step is to transfer the raw data into Civil 3D 2025 so that the analysis and mapping can begin. There are several ways to accomplish this, but in this chapter, you’re going to do it the way a surveyor would do it. The process of importing data requires some important questions to be answered. For your first try, however, you’re going to accept all the defaults and see what happens.
Exercise 3.2: Import Survey Data
In this exercise, you’ll import survey data into a survey database and into a drawing.
- Open the drawing named Import Survey Data.dwg which you can download from Youtube video description below.
- On the Home tab of the ribbon, click Import Survey Data.
- Select the Essentials 1 survey database, and click Next.
- Under Data Source Type, select Point File.
- Click the plus icon under Selected Files, and browse to the Chapter 03 class data folder.
Survey Data Sources
Survey data can come in several forms, depending on the hardware and/or software used to create it. Here are a few of the most common forms:
- Field Book File: This is considered a legacy format unique to Autodesk products such as Land Desktop and older versions of Civil 3D. Many surveyors have moved on from field book files, but some have done so fairly recently. For that reason, you might still find them to be somewhat common. One difference with field book files is that they can store the measurements exactly as they were taken in the field. The other formats listed here contain points that have been reduced to coordinates.
- LandXML File: Many civil engineering and surveying programs can export data in the form of LandXML, including Civil 3D 2025. This nonproprietary format enables data to be exchanged between programs created by different software companies.
- Point File: The point file is probably the most generic and universally accepted way of delivering point data. This type of file is plain text and can be opened in a program like Microsoft Notepad. Regardless of age, cost, or origin, nearly all surveying and civil engineering programs are capable of producing this type of file.
- Points From Drawing: With this option, you can open a drawing that already contains points and add them to your survey database. Remember that the survey database is stored outside the drawing, so the points you see in the drawing are a representation of what is stored there.
6: For Files Of Type, select the Text/Template/Extract File (*.txt) option. Then select Topo Survey.txt, and click Open.
7: Under Specify Point File Format, scroll down and select PNEZD (Comma Delimited).
8: Click Next. In the Specify Network dialog box, note that <none> is selected for the current network. Click Next.
9: In the Import Options dialog box, check the boxes next to Process Linework During Import and Insert Survey Points.
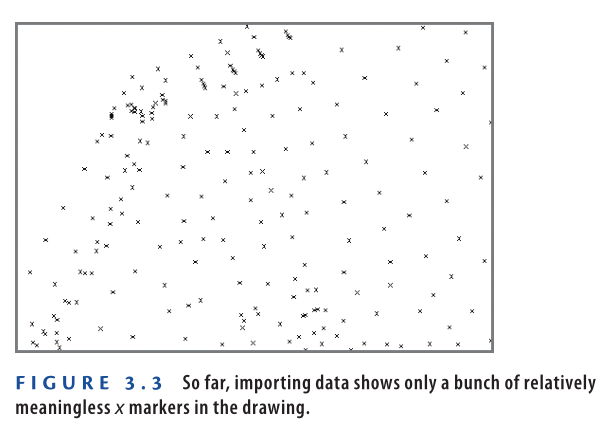
10: Verify that Current Figure Prefix Database and Current Linework Code Set are both set to Sample.Click Finish.Zoom in to the drawing, and examine what you see (see Figure 3.3).
- Save and close the drawing.
You can view the results of successfully completing this exercise by opening Import Survey Data – Complete.dwg.
https://www.mediafire.com/file/7lvwmcby98vfk4t/Import+Survey+Data+-+Complete.dwg/file
The survey database named Essentials 2 is provided for the next exercise and matches what you should have at the end of this exercise. It contains the same points you just imported.
Watch Complete video here for this Exercise:
Importing Points without a Survey Database
Sometimes you may want to import points straight into your Civil 3D 2025 drawing without the extended data-management capabilities of the survey database. You can do this using the Points From File command on the Insert tab of the ribbon, as shown in the following illustration.
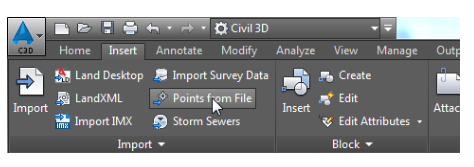
The resulting dialog box provides only one choice for file format—a text file—and no association with a survey database or linework code is set.
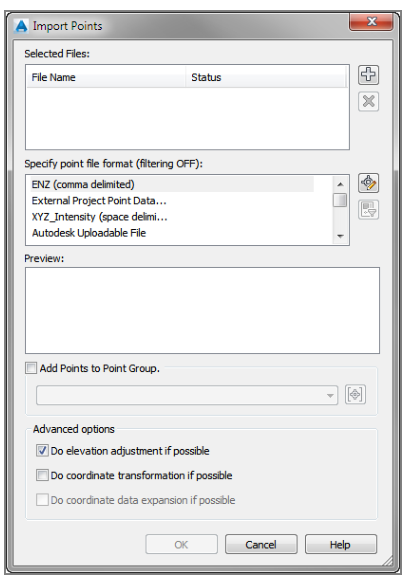
For that reason, some of the features you’ll learn about later in this chapter will not be utilized. These include the automatic generation of linework, accuracy adjustment, and others.
Automating Field-to-Finish
The term field-to-finish refers to the process of transforming raw survey field data into a finished drawing. Before computers, the point data collected in the field was plotted on paper by hand, and draftspeople skillfully connected the dots and employed other methods to create the desired topographic map. The process was manual in the truest sense of the word. Next came the first CAD programs, in which points could be plotted on a computer screen and the dots connected using primitive entities such as lines, arcs, and polylines. This is what many would now refer to as a “manual” process.
As you might guess, the process of making a drawing out of point data is quite tedious and presents an opportunity for automation. Imagine using the result from the steps in the previous section (see Figure 3.3) to create a map of the land. With no information accompanying the points, it would be nearly impossible. In the following sections, you’ll see how to use several Civil 3D 2025 features to automate this process, resulting in a drawing that is 80- to 90-percent complete immediately after you import the raw field data. However, as is usually the case, the more automation you want, the more setup you’re required to perform. Automation is another way of saying that you’re going to make a bunch of decisions ahead of time and ask the computer to carry out those decisions when needed.
The following Civil 3D features enable you to convert raw field data into drawing information.
Linework Code Set
To create linear features using connected points, someone has to tell those features when to start, when to end, when to draw curves, when to draw straight lines, and so on. In other words, it can be a bit more complicated than “Draw a line from point 1 to point 2.” Field crews use codes to carry out these geometric instructions.
For example, they might include the string BEG when locating the first point on a fence line, which means to begin a new feature at that point. The linework code set correlates these field codes with instructions that control the generation of linework in the drawing. This is the way of telling Civil 3D 2025 that BEG means “begin drawing here,” BCV means “begin curve here,” and so on. Another way to think of a linework code set is as a translator between field language and Civil 3D language.
Exercise 3.3: Apply a Linework Code Set
In this exercise, you’ll assign a linework code set to your drawing and apply it to points that have been imported.
- Open the drawing named Linework Code Set.dwg which you can download from Youtube video description below.
- Click the Survey tab of the Toolspace.
- If the contents beneath the Essentials 2 survey database are not visible, right-click Essentials 2 and select Open For Edit.
If you receive an error message here, you may not have installed the datasets correctly. Refer to the introduction for instructions on installing the datasets. - Expand Import Events. Right-click Topo Survey.txt, and select Properties.
- Click the Browse icon next to File to open the text file. Notice the codes BEG, BCV, ECV, and END.
These are the codes used in the field to represent Begin Feature, Begin Curve, End Curve, and End Feature. If you scroll down in the text file, you’ll also see the CLS code, which represents Close Feature. - Close the text file, and click Cancel to dismiss the Import Event Properties dialog box.
- Click the icon in the top-left corner of the Survey tab to edit the survey user settings.
- Click the Browse icon next to Linework Code Sets Path, browse to the Chapter 03 class data folder, and click OK. Click OK to dismiss the Survey User Settings dialog box.
- On the Survey tab, right-click Linework Code Sets and select Refresh. Click the plus sign next to Linework Code Sets. You should now see Essentials listed as a linework code set.
- Under Linework Code Sets, right-click Essentials and select Make Current.
- Under Linework Code Sets, right-click Essentials and select Edit.
Notice that the codes used for Begin, End, Begin Curve, End Curve, and Close now match what you saw in the text file. The codes in the linework code set named Sample were different, and therefore no linework was drawn when you imported the survey data. - Click Cancel to dismiss the Edit Linework Code Set dialog box.
- Under Import Events, right-click Topo Survey.txt and select Process Linework.
- For Current Linework Code Set, select Essentials, and click OK.
- Save and close the drawing.
You can view the results of successfully completing this exercise by opening Linework Code Set – Complete.dwg.
https://www.mediafire.com/file/r0ilsmc2u8mu4wa/Linework+Code+Set+-+Complete.dwg/file
The survey database named Essentials 3 is provided for the next exercise and matches what you should have at the end of this exercise.
Point Styles
Not all points are meant to be connected with other points. Some represent stand-alone features such as power poles, manholes, or trees. These types of features are typically represented with a symbol that either resembles their true form or uniquely identifies them. With the Point Styles feature, a symbol can be used to mark a point, meaning the likeness of a power pole, manhole, or tree can be used instead of an x or a dot.
Point Label Styles
For some points, you might want labeling to be included automatically. For example, you may want trees to be labeled with their common names or manholes to be labeled with their top elevations. When the annotation is very uniform, Point Label Styles can be employed to provide the desired labels automatically.
Description Keys
As discussed, it takes a lot of points to capture several acres of land effectively. To make things even more challenging, field crews often use abbreviated versions of descriptions to represent points, such as EP for edge of pavement, CLRD for centerline of road, and so on. The result is hundreds or even thousands of points all clumped together and labeled with cryptic abbreviated descriptions.
Description keys solve this problem by automatically sorting the points onto the appropriate layers, rewriting the abbreviated descriptions to full-length descriptions, and automatically applying point styles to control the appearance of the points. For example, a description key takes a point coded as PP, places it on the utility layer, displays it as a power pole, and rewrites the description to say POWER POLE. Imagine the time saved when this is done automatically for 10,000 points.
Exercise 3.4: Configure and Apply Description keys
1: Open the drawing named Description Keys.dwg from the Chapter 03 class data folder.
2:: Click the Settings tab of the Toolspace, and expand Point ➢ Description Key Sets.
3: Right-click Essentials, and select Edit Keys.
4: Click the cell in the Style column for code TR* to open the Point Style dialog box.
5: Select Tree as the point style, and click OK.
6: Click the green check mark to dismiss Panorama.
7: Click the Prospector tab, and then click Points.
8: In the listing of points at the bottom of Prospector, scroll to the right and click the Raw Description column heading to sort the points by that property.
9: Scroll to the bottom of the list where all the TR points are now located.
10: Right-click one of the points, and select Apply Description Keys. One of the points in the drawing should become a tree symbol.
Once completed, you’ll see the description keys applied, automating the process of turning the points into recognizable tree symbols.
11: Select all the TR points, and use the Apply Description Keys command to change them. All the trees in the drawing should now be clearly visible and appropriately represented.
12: Return to the Settings tab, and edit the Essentials description key set again. This time, assign a point label style of Description Only to the TR* code. Apply description keys to the TR points from within Prospector as you did earlier.
13: Edit the TR* description key code again, changing the Format value to $1 ″ $2 ( $1mm $2 ).
14: Apply the description keys to the TR points again. This time, the labels should read like 12″ (300 mm) PINE, 15″ (375 mm) MAPLE, and so on.
15: Save and close the drawing.
You can view the completed results by opening Description Keys – Complete.dwg.
https://www.mediafire.com/file/aiaf4oj154ikk8u/Description+Keys+-+Complete.dwg/file
Note that no change was made to the survey database during this exercise.
Watch Complete video here for this Exercise:
Whats up with the $ Sign?
In the previous exercise, the $ sign was used as a special code to reference parts of the raw description and include them in the full description. The raw description is divided into components that are numbered from left to right, starting at $0. For example, if the raw description is TR 12 OAK, then:
$0represents TR$1represents 12$2represents OAK
Thus, $1 ″ $2 would be replaced with 12″ OAK. Similarly, for a raw description like TR 300 OAK, $1mm $2 would translate to 300 mm OAK.
This allows field data to be entered quickly, with minimal effort, while still enabling the drawing to be automatically formatted with detailed descriptions.
Figure Prefix Database
The Figure Prefix Database is responsible for controlling how Civil 3D translates field codes into specific drawing features, especially after they are drawn. It defines the layer, style, and other properties for features created during the survey process. For example, when a feature is drawn based on a certain field code (like a fence or road centerline), the figure prefix database determines the layer it is drawn on, the line style, and whether it should have a special purpose, such as being associated with certain types of work or features.
The Figure Prefix Database helps manage:
- Layer Assignment: It ensures that specific features are placed on the correct layers, based on the type of feature (e.g., property boundaries on a “Boundaries” layer, road centerlines on a “Road” layer).
- Styles and Symbology: It dictates the appearance of the lines, such as line type, color, and thickness, ensuring the drawing looks organized and follows standard practices.
- Purpose and Classification: It can categorize features based on their role in the drawing, such as utility lines, roads, or natural boundaries, making it easier to understand and analyze the data later.
This database allows for more automation, reducing the need for manual adjustments after the data is imported into Civil 3D.
The Figure Prefix Database is the means by which decisions regarding feature types, like property lines or breaklines, can be made upfront for specific codes. For instance, any feature drawn through points coded EP (edge of pavement) will be drawn on the pavement layer and tagged as a key component for establishing a hard edge in the 3D model of the terrain, commonly referred to as a breakline.
This allows surveyors and engineers to define how different elements are handled and represented in the drawing based on predefined codes, making it easier to manage the drawing’s complexity and maintain consistency across multiple projects.
Exercise 3.5: Apply a Figure Prefix Database
- Open the drawing named Figure Prefix Database.dwg which you can download from Youtube video description.
- On the Survey tab of the Toolspace, click the Edit Survey User Settings icon in the top-left corner.
- Click the Browse icon next to Figure Prefix Database Path. Browse to and select the Chapter 03 class data folder, and then click OK.
- Click OK to dismiss the Survey User Settings dialog box. Right-click Figure Prefix Databases, and select Refresh. Click the plus sign next to Figure Prefix Databases to expand its contents. You should now see Essentials listed under Figure Prefix Databases.
- Right-click Essentials, and select Make Current. Right-click Essentials again, and this time, select Manage Figure Prefix Database.
- Scroll down and examine the codes in the Name column. These match the codes you saw in the text file containing the survey data.
- Click Cancel to dismiss the Figure Prefix Database Manager dialog box.
- If the contents of the Essentials 3 survey database are not visible, right-click Essentials 3 and select Open For Edit.
- Expand Import Events. Right-click Topo Survey.txt, and select Process Linework.
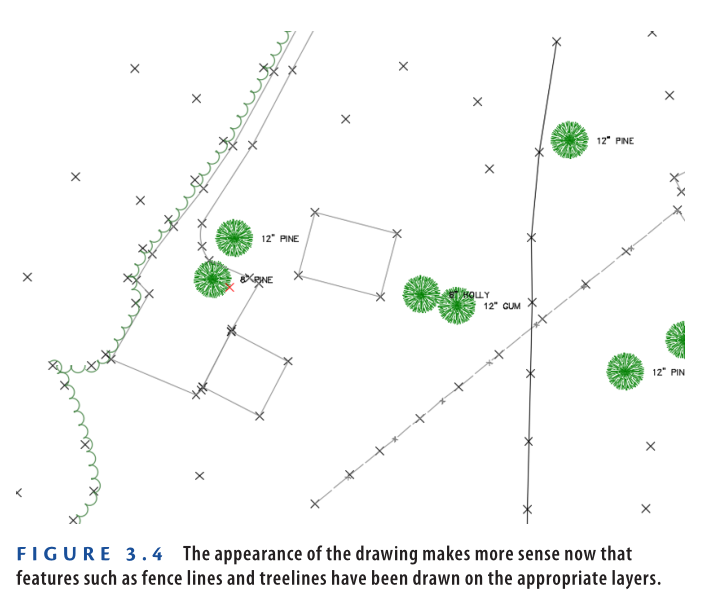
- In the Process Linework dialog box, select Essentials for Current Figure Prefix Database and click OK. Civil 3D redraws the linework, this time doing so on the appropriate layers. This is evident in the…
…linetypes that are applied to the treelines and fence lines, which are now appropriately represented on the drawing (see Figure 3.4).
- Save and close the drawing.
You can view the results of successfully completing this exercise by opening Figure Prefix Database – Complete.dwg .
https://www.mediafire.com/file/u0qwj24ah5avlmc/Figure+Prefix+Database+-+Complete.dwg/file
The survey database name Essentials 4 is provided for the next exercise and matches what you should have at the end of this exercise.
A survey figure in Civil 3D refers to a linear feature that is defined using survey data. It represents various features, both visible (such as fence lines, edges of pavement, and treelines) and topographic features (like the tops and bottoms of embankments). These figures are essential for tying design work into existing conditions, like surfaces, feature lines, and corridors. Survey figures help create accurate representations of features that can be utilized in the design process, and they are typically organized into layers, with topographic features being turned off when plotting the drawing.
Point Groups
Point groups are another way of managing large amounts of point data. This feature enables you to sort points based on various factors, such as description, elevation, point number, and manual selection. You can set up point groups ahead of time so that points can be automatically sorted into groups as they are imported into the drawing. Additionally, you can create new point groups on the fly to sort points as needed.
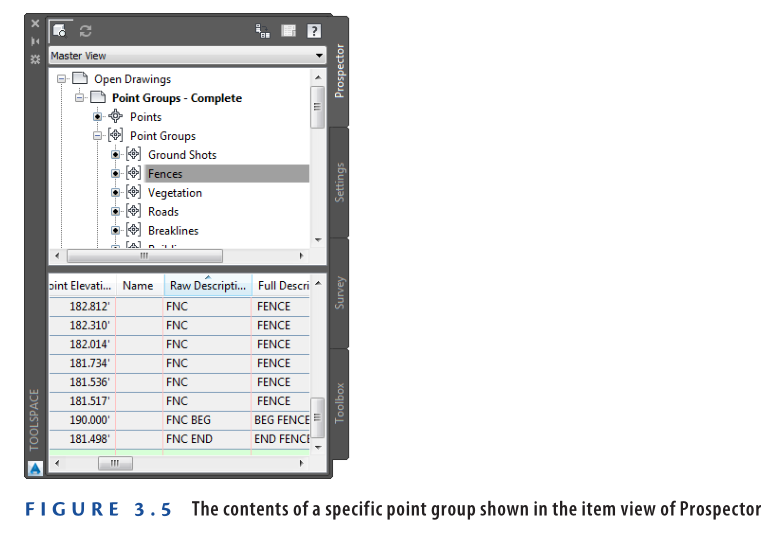
Once points have been grouped, you can use them to study and manipulate multiple points at once. The groups are listed in Prospector, and you can view the points contained in each group simply by clicking the group name and viewing the contents of the point group in the item view at the bottom. Moreover, many point-editing commands allow you to select points by group, enabling you to modify large numbers of points at once.
Point groups also enable you to assign default point styles and label styles to points within the group. With this capability, you can make points in a certain group take on specific graphical characteristics by controlling the point style and point label style.
Exercise 3.6: Create and Apply Point Groups
In this exercise, you’ll configure several point groups and use them to organize points in your drawing as well as control their appearance.
- Open the drawing named Point Groups.dwg which you can download from Youtube video description below.
- In Prospector, right-click Point Groups and select New.
- On the Information tab of the Point Group Properties dialog box, type Buildings in the Name field. Select Basic as the point style and <none> as the point label style.
- Click the Raw Description Matching tab. Check the box next to BLD*, and click OK.
- Expand Point Groups, and click the Buildings point group in Prospector. Examine the list of points shown in the Prospector item view at the bottom. Note that they all are points with a BLD description.
- Create the following point groups with the associated raw descriptions listed. Use a default Point Style value of Basic and a default Point Label Style of <None> for each point group:
- Breaklines: BOB, BOTD, SWL, TOB, TOPD
- Roads: CLRD, DW, EP, ES
- Vegetation: ESHB, TL, TR
- Fences: FNC
- Ground Shots: GS
Secret Code?
You may be wondering what the raw descriptions mean in step 6 of Exercise 3.6. What you see here are abbreviations for items commonly located in the field by surveyors. In the interest of efficiency, abbreviated codes are typed in the field instead of the full names of the features. Here is what these particular examples stand for:
Breaklines
- BOB: Bottom of bank
- BOTD: Bottom of ditch
- SWL: Swale
- TOB: Top of bank
- TOPD: Top of ditch
Roads
- CLRD: Centerline of road
- DW: Driveway
- EP: Edge of pavement
- ES: Edge of shoulder
Vegetation
- ESHB: Edge of shrub
- TL: Treeline
- TR: Tree
Fences
- FNC: Fence
Ground Shots
- GS: Ground shot
7: Click the Settings tab, and expand Point ➢ Description Key Sets.
8: Right-click Essentials, and select Edit Keys.
9: Hold down the Shift key to select all rows except the last one (TR*). Then right-click the Style column heading, and select Edit.
- Select <default>, and click OK. Click the green check mark to close Panorama.
- In Prospector, right-click the All Points point group and select Apply Description Keys. This applies the new style choice of <default> to all points except trees. Now the point style assigned by the point groups is able to have an effect, and most of the points change from x markers to circle markers.
- In Prospector, right-click the Ground Shots point group and select Properties.
- On the Information tab, select Ground Shot as the default point style and Elevation Only as the default point label style. Click OK, and notice what happens to all the ground shot points in the drawing.
- Click the Output tab of the ribbon, and then click Export Points.
- Check the box next to Limit Points To Point Group, and choose the Roads point group.
- Click OK, and browse to your Chapter 03 class data folder. Enter Road Points as the name of the file, and click Open. Then click OK to dismiss the Export Points dialog box.
- Save and close the drawing.
You can view the results of successfully completing this exercise by opening Description Keys – Complete.dwg.
https://www.mediafire.com/file/nt6lqo01vccx1gx/Description+Keys+-+Complete.dwg/file
The survey database was not changed as a result of this exercise.
Watch Complete video here for this Exercise:
Point Groups vs. Description Keys
At this point, you may be scratching your head a bit, thinking that a few minutes ago you learned that description keys control the point style and point label style assigned to a point. Well, you’re right—they do. However, you may have also noticed that when you assign these styles using description keys, the choice at the top of the list in each case is <default>. This choice could (and maybe should) be changed to say ByPointGroup, because that’s what it essentially means. When you configure your description keys to use <default> as the style, you’re deferring the decision about what style to use for the point groups. If you choose anything else, you’re making that decision right then and there.
Feel better about it? Well, unfortunately, there’s another feature to consider that makes this a little more complicated but also gives you even more flexibility when stylizing points. One of the properties of a point group is the ability to set up an override. When you set up a point style or point label style as an override, it means you’re going to apply that style regardless of whether it’s <default> or something else. The Overrides tab in the Point Group Properties dialog box enables you to do this.
If you’re wondering whether point groups or description keys are best to use, the answer is both. By thoroughly understanding how each method can be applied to your point data, you can use both point groups and description keys to stylize and organize your points in the best way possible. When you’re starting out, however, you may want to pick one method or the other, completely develop that method, and then sprinkle in the other method little by little, observing and understanding how the two work together.
Evolve Your Standards
In the previous exercises, you made some corrections and assigned a specific linework code set and figure prefix database to the data you imported. In an actual production environment, the changes you make to the description key set should be incorporated into the company template so that the tree points are handled correctly for all future jobs. The point groups you create could also be included in the company template so that they’re available on all future jobs.
In addition, the linework code set and figure prefix database that you use could be assigned as defaults so that they are automatically applied to future data imports. A CAD manager typically handles this type of configuration management, but end users like you usually identify the needs for the changes. When you’re working with Civil 3D in a production environment, be sure to work with your CAD manager to make sure you and your coworkers are leveraging the configuration of Civil 3D as much as possible.
Editing Survey Points
As discussed, it takes many points to survey a piece of land—that’s hundreds or even thousands of individual measurements and hand-typed field codes. On nearly every project, there will be items that require editing. Once the data has been imported into Civil 3D, the field crew is off to its next job, and the task of fixing things up belongs to you.
For several reasons, editing survey points is a bit different from editing “regular” points, properly referred to as COGO points. One reason is that survey points are considered “sacred” and are not typically moved or modified in any way without considerable thought and/or the supervision of a surveyor. The second reason, related to the first, is that Civil 3D uses a separate survey database system to store points. The points in the drawing are essentially locked and can’t be changed unless the information in the survey database changes. With this system, a surveyor can send out the drawing file without sharing the survey database that goes with it. When the points in the drawing are separated from the survey database, they become locked and can’t be easily modified. In this way, the survey database gives control of the points to the person who created them.
Exercise 3.7: Edit Survey Points
In this exercise, you’ll edit a survey point to correct a field coding error. You’ll demonstrate that access to the survey database is necessary for editing survey points.
- Open the drawing named Edit Survey Points.dwg which you can download from Youtube video description below. If a survey database is open, right-click it and select Close Survey Database.
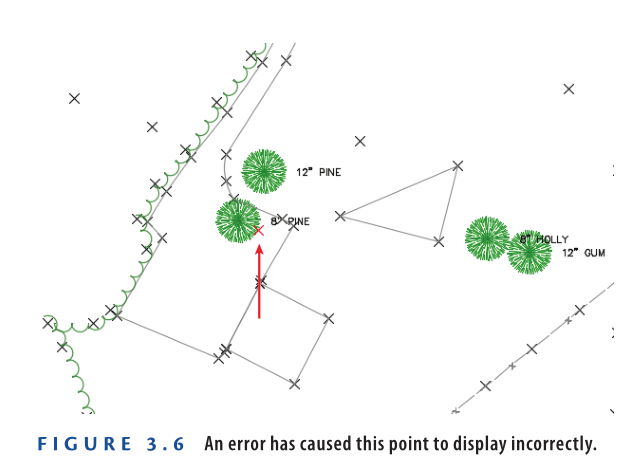
- Locate and zoom in to the red point along the west treeline, as shown in Figure 3.6.
- Open the Properties window, and then select the red point. Note that there is a typo in the raw description. It should say TR 12 PINE (TR 300 PINE) instead of TTR 12 PINE (TTR 300 PINE). You can’t edit the raw description here because the data is stored in the survey database.
4: With the point still selected, click Survey Point Properties on the ribbon. A dialog box opens, informing you that you must open a survey database.
5: Click OK to dismiss the dialog box. Then right-click the Essentials 4 survey database on the Survey tab, and select Open For Edit.
6: With the red point still selected, click Survey Point Properties on the ribbon.
7: Edit the description to say TR 12 PINE (TR 300 PINE), and click OK.
Survey Points vs. COGO Points
As previously mentioned, there are two types of points: COGO points and survey points. How can you tell the difference? Here are a few characteristics of each to help you distinguish between the two:
Survey Point Characteristics
- Only survey points are displayed on the Survey tab (COGO points are not).
- Survey points are displayed on both the Prospector and the Survey tabs.
- Survey points have an icon next to them that looks like a survey target (an hourglass inside a box overlaid on crosshairs).
Survey points can’t be moved without accessing the survey database and using specialized commands for editing survey points. - Survey points can’t be edited in the Properties window.
COGO Point Characteristics - COGO points are not displayed on the Survey tab.
- COGO points have an icon next to them that looks like a circle overlaid on crosshairs.
- COGO points can be moved, even using basic, non–Civil 3D drafting commands.
- COGO points can be edited in the Properties window.
- Press Enter to end the command. You’re prompted to update linework in the drawing.
- Click No to dismiss the Edit Survey Point Properties—Process Linework dialog, because the change you made does not affect linework.
- Click the red point, right-click, and select Apply Description Keys.
- Save and close the drawing.
You can view the results of successfully completing this exercise by opening Edit Survey Points – Complete.dwg.
https://www.mediafire.com/file/eji1fa2bk91ylvn/Edit+Survey+Points+-+Complete.dwg/file
The survey database named Essentials 5 is provided for the next exercise and matches what you should have at the end of this exercise.
Editing Survey Figures
Mistakes in the field can lead to errors in the way linework is drawn. Once again, the changes need to be made a certain way because you’re dealing with special survey objects, this time survey figures. Survey figures are linked to the survey database, but unlike survey points, they can be edited without accessing the survey database. If you edit survey figures in this way, you need to be aware of the consequences and ensure that the edits reflect the correct information.
.that the objects you’ve edited are no longer in sync with the survey database. When this occurs, you should take steps to keep them in sync to ensure that the correct data is used in the future.
Exercise 3.8: Edit Survey Figures
In this exercise, you’ll edit several survey figures to correct errors that took place due to incorrect translation from the field to the drawing.
- Open the drawing named Edit Survey Figures.dwg which can be download from Youtube video description below.
- If the contents beneath the Essentials 5 survey database are not visible, right-click Essentials 5 and select Open For Edit.
- In the top-right viewport, locate the building that is missing its north side. Click the building figure line, and then click Survey Figure Properties on the ribbon. Notice that point 285 is missing a CLS (close) code that would provide the north side of the building by closing the rectangle.
- Click point 285 in the point list; then set the Closed value to Yes, and click OK. The shape of the building is now closed. Because you used the Survey Figure Properties command to edit this figure, the drawing and the survey database are in sync.
- Press Esc to clear the previous selection. Pan to the southeast until you can see the building to the west of the 6″ (150 mm) pine. This building should appear as two separate buildings.
- Click the building figure, and then click Survey Figure Properties on the ribbon.
- In the Figure Properties dialog box, click point 288 and then click the red X icon. Remove points 289, 290, and 291 in the same manner.
- Click OK to close the Figure Properties dialog box. Now only the north building is shown in the drawing.
- Right-click Figures on the Survey tab, and select Create Figure Interactively.
- When prompted, enter BLD2 as the figure name, and click OK.
- Click the four points that make up the smaller building, and then press Enter.
12: In the Figure Properties dialog box, set the Closed value to Yes. If necessary, adjust the order of the points using the arrow buttons. Click Apply and then OK when the blue figure outline appears as a rectangle in the drawing. The building figure now appears as it should, and the two separate buildings are represented properly, as shown in Figure 3.7.
13: Save and close the drawing.
You can view the results of successfully completing this exercise by opening Edit Survey Figures – Complete.dwg.
https://www.mediafire.com/file/c96nid0goldg190/Edit+Survey+Figures+-+Complete.dwg/file
The survey database named Essentials 6 is provided for the next exercise and matches what you should have at the end of this exercise.
Creating Additional Points
groups, assigned point styles and label styles, and used in point reports or calculations. However, these points are not tied to a survey database and can be freely edited, moved, or deleted without the constraints of survey data management.
Some common situations where you might need to create additional points include:
- Proposed test borings: During the design phase, you may want to place points for proposed test borings to mark locations where further fieldwork will be done.
- Property corners: Points can be created to indicate property corners that need to be surveyed later.
- Importing point files: If you have a point file to import into the drawing but do not want it tied to a survey database, you can use these tools to bring in the data as regular points.
Civil 3D provides a variety of options for creating and managing these points, allowing for customization and easy organization of point data.
When you create additional points in Civil 3D, they are flexible and versatile, but there are trade-offs to consider:
- No Automatic Linework Generation: Unlike survey points, points created manually or imported into the drawing don’t automatically generate associated linework. This means you must manually create any linework (like boundary lines or alignments) if needed.
- No Survey Database Protection: These points do not have the same protections as survey points. While survey points are controlled within a survey database and are not easily editable, points created in this way can be freely edited, moved, or deleted by anyone who has access to the drawing file.
- Exportable for Field Work: Similar to survey points, the created points can be exported to a file. This file can then be uploaded to a portable device for field staking, which allows the points to be used in the field for tasks such as marking locations for construction or further surveys.
Despite the flexibility in creating and editing these points, it’s important to remember that they lack the control and oversight associated with survey database points, making them more prone to errors if not managed properly.
Exercise 3.9: Import Points and Create Points Manually
In this exercise, you’ll begin by importing points that represent property corners found on the site. Then, you’ll create stake-out points to assist field crews in locating several missing property corners. You’ll also create points along the proposed road centerlines. These points will represent the locations of soil-test borings to be performed on the site.
- Open the drawing named Stake Out.dwg which you can download from Youtube video descriotr. This drawing contains a calculated property boundary reconstructed from a deed or other source of information. It also contains a preliminary layout of the road centerlines that will be used to determine soil-test boring locations. You’ll begin by inserting points into the drawing that represent property corners located in the field.
- On the Insert tab of the ribbon, click Points From File.
- In the Import Points dialog box, select PNEZD (Comma Delimited) as the format. Then click the plus sign icon and browse to the Chapter 03 class data folder.
- For Files Of Type, select the Text/Template/Extract File (*.txt) option. Then select Found Corners.txt, and click Open.
- Click OK to dismiss the Import Points dialog box.
- In the Duplicate Point Number dialog box, under Resolution, select Add An Offset. Type 1000 in the box below Add An Offset From, and click OK.
7: In Prospector, expand Point Groups. Right-click Found Corners, and select Update. This applies the default styles from the point group to the newly imported points. Found corners appear with red markers and text. Notice that two points are missing along the south property boundary, as well as one point on the east property boundary and one at the northwest corner (four points in all). Finding and locating these corners in the field will greatly improve the accuracy and validity of the property survey.
8: On the Home tab of the ribbon, click Points ➢ Point Creation Tools.
9: On the Create Points toolbar, click the button on the far left to launch the Miscellaneous Manual tool. In the left viewport, snap to the locations of the missing points.
10: In Prospector, right-click the Corners To Be Found point group and select Update. These points display in blue.
11: On the Create Points toolbar, click the chevron on the far right to expand the toolbar.
12: Expand Points Creation, and enter BORE as the default description.
13: Click the down arrow on the button farthest to the left, and then click Measure Object.
14: Click one of the magenta road centerlines. Press Enter three times to accept the default starting station, ending station, and offset.
15: Type an interval of 250 (80), and press Enter. The points are created at a 250′ (80-m) interval along the polyline you’ve selected.
16: In Prospector, update the Test Borings point group.
17: Repeat steps 13 to 16 for the remaining road centerlines.
18: On the Output tab of the ribbon, click Export Points.
19: For format, select PNEZD (Comma Delimited). Check the box next to Limit To Points In Point Group, and select Corners To Be Found.
- Click OK, and browse to the Chapter 03 class data folder. Specify a filename of Corners to be Found.txt.
- Repeat steps 19 to 21 for the Test Boring point group to create a Test Borings.txt point file.
- Save and close the drawing.
You can view the results of successfully completing this exercise by opening Stake Out – Complete.dwg.
https://www.mediafire.com/file/xqn8xciu1vx5q4x/Stake+Out+-+Complete.dwg/file
There was no change to the survey database as a result of this exercise.
Watch complete video for this Exercise:
For All Exercise Videos of this Chapter click here:
https://www.youtube.com/watch?v=ZH6ytsYKSlw&list=PLUfG0g2DwpSvD925rYUJIG4QTccQea3Y5
Now You Know
Now that you have completed this chapter, you understand the world of survey data as it exists in the Civil 3D environment. You understand that survey data must reside in a survey database that exists separately from the drawing file. You know how to import data into the survey database and display it in your drawing as points and linework. You know how to automate the organization and graphical properties of the points and linework using linework code sets, description keys, the figure prefix database, and point groups. You can edit survey points and survey figures by accessing the survey database and making changes using the appropriate tools. Finally, you know several additional methods for importing points and creating them manually.
With the knowledge and skills you have gained in this chapter, you’re ready to begin working with survey data in Civil 3D: turning it from raw field data into a drawing representing the existing conditions of a project.